Pay Attention to “Non-Confirmations”
When a trend is strong, related markets tend to move in unison.
However, when a trend is near exhaustion — a bullish or bearish trend, “non-confirmations” often occur. A non-confirmation occurs when one market makes a new high (or low), but a related market does not.
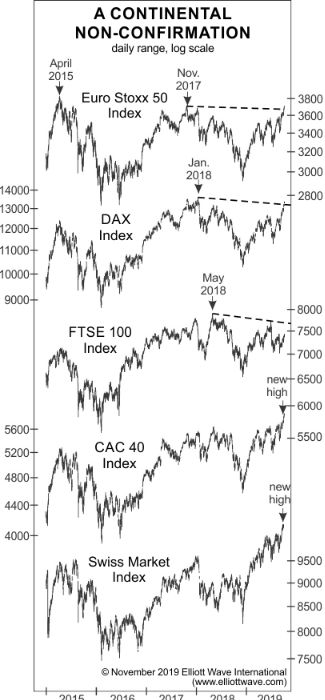
As cases in point, our November Global Market Perspective discussed the details of the non-confirmations in Europe as it showed two charts. Here’s the first:

The Euro Stoxx 50, the DAX and the FTSE 100 (top three graphs) have so far failed to confirm new multi-year highs in the CAC 40 and the Swiss Market Index (bottom two graphs).
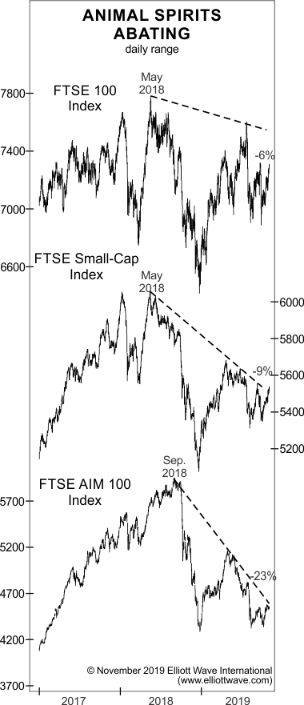
Here’s the second chart with continued commentary:

The chart depicts [a] critical loss of juice in Britain’s higher-beta indexes. Notice that while the FTSE 100 is off 6% since its May 2018 high, the Small-Cap index and the AIM 100 are down 9% and 23%, respectively. These non-confirmations are important, because markets almost always splinter when big changes in social mood are afoot. … It’s only a matter of time before the broad indexes abandon the bull-market party.
As we all know, abandon it they did — big-time!
The media blamed the big plunge in global stock market values on the coronavirus.
Yet, it’s notable that our global analysts’ forecast for the end of Europe’s “bull-market party” occurred about two months before the coronavirus flared up in China — and six weeks before the outbreak hit Europe.
So, clearly, our bearish European forecast was not based on the coronavirus.
Elliott Wave International analysts base their financial forecasts on the Elliott wave model plus technical and sentiment indicators, not the news.
As the Wall Street classic Elliott Wave Principle: Key to Market Behavior by Frost & Prechter noted:
Sometimes the market appears to reflect outside conditions and events, but at other times it is entirely detached from what most people assume are causal conditions. The reason is that the market has a law of its own. It is not propelled by the external causality to which one becomes accustomed in the everyday experiences of life. The path of prices is not a product of news. Nor is the market the cyclically rhythmic machine that some declare it to be. Its movement reflects a repetition of forms that is independent both of presumed causal events and of periodicity.
There are other typical indicators that flash the red light. Traders sentiment is one. At extremes, the sentiment gets excessively bullish in a bull market, or it becomes extremely bearish in a bear market.

Another indicator is RSI non confirmation when RSI is not making new high higs or new lows while stocks are.
If you wish to read more about market indicators to make informed decisions, now is the time to get insights into what really governs the path of stock market prices — the Wave Principle.
You can do so by reading the online version of Elliott Wave Principle: Key to Market Behavior — free. This free access to the Wall Street classic is available when you join Club EWI. Membership is also 100% free.
You can have this “must read” book on your computer screen in just moments. Get started.