Why Most Investors Are “Doomed” to Miss Major Market Turns
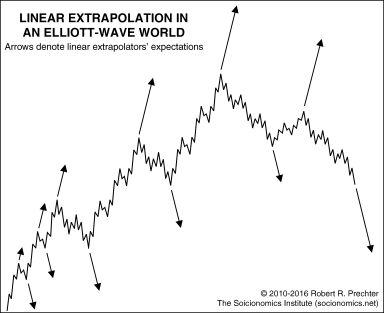
“The arrows show how conventional futurists approach forecasting”
The reason why most investors miss key turns in financial markets is that they linearly extrapolate a trend into the future.
If a market is going down, these investors expect that market to continue to go down and if it’s going up, they expect it to continue to go up.
In other words, most investors have no method for anticipating a turn. By contrast, the Elliott wave model does.
The September Elliott Wave Theorist, a monthly publication which provides analysis of financial and major cultural trends, provides insight with this graph and commentary:

[The chart] depicts the fractal movements of the stock market as described by an idealized version of the Elliott wave model. The arrows show how conventional futurists approach forecasting. Because they project trends linearly, they are most convinced of an old trend’s continuation at the very time when waves at several degrees of trend are culminating.
That’s not to say that Elliotticians are perfect. Even those who use the Elliott wave model in their market analysis might make the mistake of looking for too many turns.
As the new Elliott Wave Theorist also says:
Being patient while an Elliott wave plays out can be challenging for a mind bent on looking for evidence of change. But at least Elliotticians are not doomed to miss every turn. They may be early or late, but they are not inevitably, pathologically late in identifying turns, as linear extrapolators are.
A recent example of how linear extrapolation almost immediately hurt investors occurred with technology stocks.
This is a Sept. 13 headline and sub-headline from Bloomberg:
Billions in Wrong-Way Bets Poured Into Biggest Tech ETF
Biggest tech ETF posted best inflow since February on [Sept. 12]
On that one date alone (Sept. 12), investors put $2.6 billion into the Invesco Trust Series 1 ETF. The very next day (Sept. 13), the NASDAQ cratered 5.16%. Talk about bad timing!
You see, the NASDAQ had rallied for four straight days before that big price slide, and many investors thought it was time to jump in and join the party.
That’s not to say that the Elliott wave model anticipated a more than 5% drop in the NASDAQ on that very day. However, the Elliott wave model had anticipated a continuation of the downward trend.
Indeed, on Friday, Sept. 9, our U.S. Short Term Update stated:
The [NASDAQ 100] rally should be complete or nearly so.
That analysis was provided just two trading days before that big one-day decline in the NASDAQ.
No analytical method can provide a guarantee, however, in our view, the Elliott wave model is far better than linearly extrapolating trends.
If you’d like to learn the details of the Elliott wave model, the definitive text on the subject is Frost & Prechter’s Elliott Wave Principle: Key to Market Behavior. Here’s a quote:
It is a thrilling experience to pinpoint a turn, and the Wave Principle is the only approach that can occasionally provide the opportunity to do so.
The ability to identify such junctures is remarkable enough, but the Wave Principle is the only method of analysis that also provides guidelines for forecasting. Many of these guidelines are specific and can occasionally yield stunningly precise results. If indeed markets are patterned, and if those patterns have a recognizable geometry, then regardless of the variations allowed, certain price and time relationships are likely to recur. In fact, experience shows that they do.
If you’d like to read the entire online version of the book for free, you can do so by joining Club EWI, the world’s largest Elliott wave educational community.
A Club EWI membership is free, and members enjoy complimentary access to a treasure trove of Elliott wave resources on financial markets, investing and trading — including videos and articles from Elliott Wave International’s analysts.
Get started right away by following this link: Elliott Wave Principle: Key to Market Behavior — get free and instant access.