A Road Map To SENSEX 100,000
By Mark Galasiewski
This article was originally published as a special Interim Report of EWI’s Asian-Pacific Financial Forecast on March 23, 2009. Since then the SENSEX has risen as much as 65%. For a limited time, Elliott Wave International is offering a full 10-page issue of the Asian Pacific Financial Forecast, Discover The Bull Markets You are Missing free.
**********************************************
Prices in India’s SENSEX have just broken above a downtrend line, imitating a pattern from 2004 that led to a strong rally. This interim report updates our wave count for India, since its wave pattern in particular may offer investors a rewarding long-term opportunity.
In the March 2009 issue of The Asian-Pacific Financial Forecast, we showed how pattern, price, time and sentiment considerations were pointing to the end of multi-month, five-wave declines in most major Asian-Pacific indexes by late March. In most cases, those lows have likely been achieved.
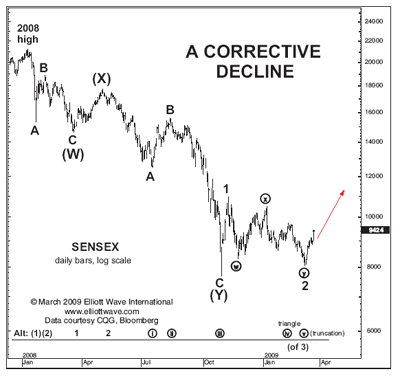
Although we have looked for a fifth wave down to below the October low in the SENSEX, it has failed to materialize. That failure plus the recent sharp reversal rally prompts our return to an earlier wave count. The daily SENSEX chart shows how the decline since the 2008 high can be counted as three waves. A three-wave decline opens the possibility of a rally back to near the 2008 highs. But there is reason to set our sights even higher.
 |
Perhaps the best argument for a bull market in Indian stocks is the potential fractal relationship we identified in the November 2008 issue, published just four days after the October low. The weekly chart below is an updated version of the one we showed at that time. Here is our analysis from the November
issue:
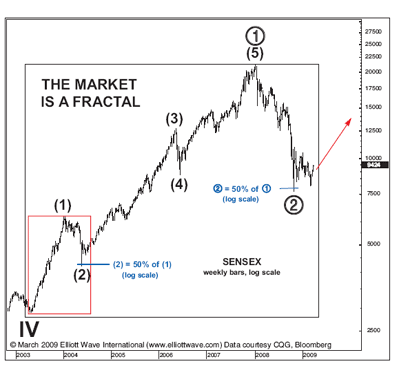 |
- “The Wave Principle teaches that the stock market is a self-similar fractal. That means that some pieces of its price record—which Ralph Nelson Elliott called waves—resemble other pieces elsewhere in that record. The weekly chart of India’s SENSEX shows just such an example. Notice how the up-down sequence labeled Intermediate waves (1) and (2) (in the small red box) is a microcosm of the larger up-down sequence from the 2003 low to the present (i.e., waves and , in the large black box). In both cases, the wave-two correction retraced approximately 50% of the wave-one advance. (We have calculated those retracements using the same logarithmic scale shown in the chart: logarithmic charting displays equal percentage moves proportionally).
- “If we have identified this “nested fractal” relationship correctly, it means that Indian stocks are about to begin Primary wave of the bull market that began in 2003. Waves and lasted more than four times the duration of waves (1) and (2). If that same proportion holds going forward, the SENSEX may continue advancing for 15 years before reaching the end of wave .”
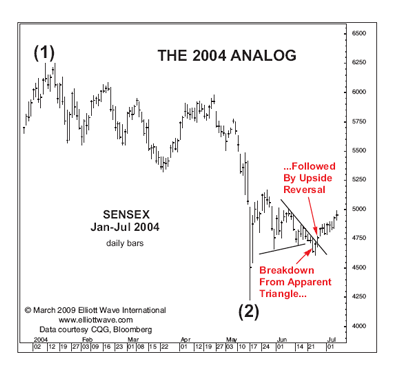
Since then, the analogy to the 2004 period (“The 2004 Analog”) has become even more interesting.
 |
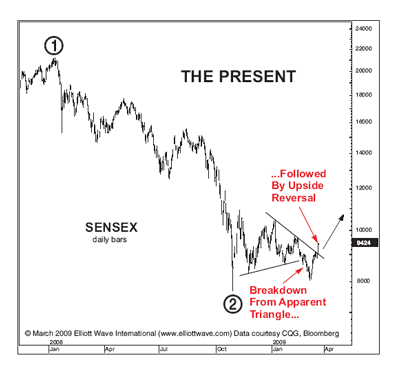 |
Just as then, prices have broken down from an apparent triangle, and then reversed and broken out above the downtrend line. In 2004, prices never looked back after the breakout. As long as prices do not fall back below the low of today’s breakout bar, we will assume that the 2003-2008 bull market will continue to provide a road map to the future of India’s stock market.
For more information emerging opportunities in Asian markets, download Elliott Wave International’s free 10-page issue of the Asian Financial Forecast.
Mark Galasiewski is the editor of Elliott Wave International’s Asian-Pacific Financial Forecast and member of EWI’s Global Market Perspective team covering Asian stock indexes.
September 2014 Update:
Here’s a clear picture of how Indian stocks are hitting new highs:
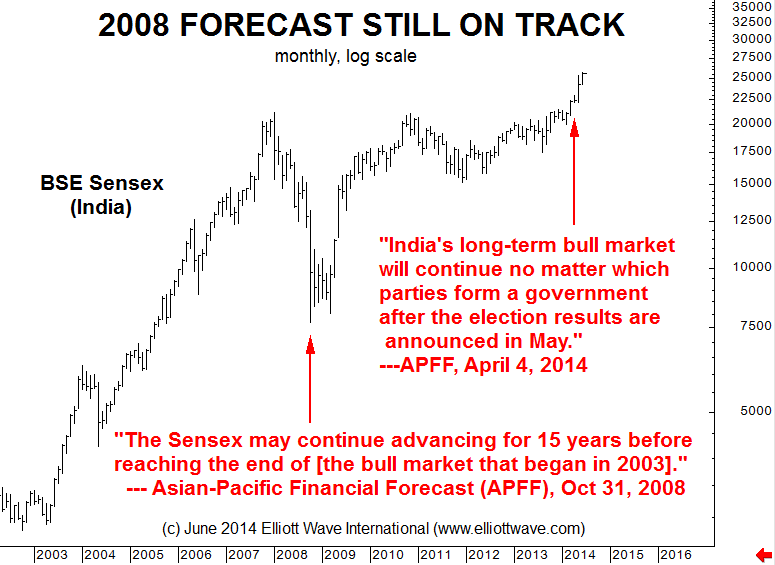
The Asian-Pacific Financial Forecast, a monthly publication from Elliott Wave International (EWI), has been on top of this bull market since India’s stock markets bottomed in 2008-09. In fact, in April 2009, EWI’s Asian analyst went on Indian TV to discuss his forecast of a 10-fold advance in the Sensex — but the interviewer was incredulous.
You might have been incredulous, too, at the time. Nearly everybody — both Indian investors and global investors — were down on Indian stocks in 2009. They thought the bear market was here to stay.
Notice, though, that its analyst’s call for a 10-fold advance has not completely played out yet. How can you get your hands on more information about this forecast for a long-term bull market in Indian stocks?
You can read about it today, free, in EWI’s special India report, “Would You Like to Have Known 5 Years Ago That India’s Stocks Would Hit New Highs Now?”
Remember — today, you can get ahead of the crowd of investors, thanks to Elliott wave analysis. And don’t miss your special savings offer at the bottom of the free report.
Start reading about Indian stocks now >>